 The desire to acquire knowledge about the surrounding world and human society is quite natural and understandable for a person. Life is so developed that an uneducated person will never occupy a high position in any field. Humanity in its mass, and each person individually, develops objectively, regardless of certain life circumstances and obstacles, but with different intensity. The speed of development depends on the quality of training.
Day Trade For Living by Andrew Aziz (best thriller novels to read txt) 📖

- Author: Andrew Aziz
Book online «Day Trade For Living by Andrew Aziz (best thriller novels to read txt) 📖». Author Andrew Aziz
In day trading, Bull Flag is a momentum fast execution strategy that usually works great on low float stocks (Chapter 4). I believe Bull Flag is a scalping strategy because these flags won't last long and you must scalp the trade - get in quickly, take your profit, and then get out.
Example of Bull Flag formation with one consolidation period.
This pattern is named Bull Flag because it resembles a flag on a pole. In Bull Flag, you have several large candles going up (like a pole), and you also have a series of small candles moving sideways (like a flag), or, as we day traders say, " conso lidating" . Consolidation means that the traders who bought stocks at a lower price are now selling and taking their profits. Although that is happening, the price does not decrease sharply because buyers are still entering into trades and the sellers are not yet in control of the price. Many traders will miss purchasing the stock before the Bull Flag starts. It is risky to buy stock when the price is in creasing. That's called " chasing the stodi ' . Professional traders aim to enter the trade during quiet times and take their profits during wild times. That, of course, is the
total opposite of how amateurs trade. They jump in or out when stocks begin to run, but grow bored and lose interest when the prices are, shall I say, sleepy.
Chasing the stocks is an account killer for beginners. You must wait until the stock finds its high point, and then wait for the consolidation. As soon as the price breaks up in the consolidation area, you can begin purchasing stocks.
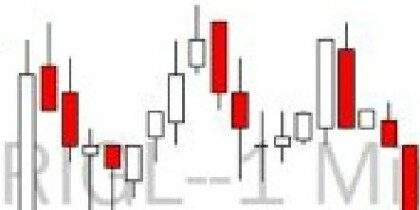
Usually a Bull Flag will show several consolidation periods. I enter in only the first and second consolidation periods. Third and higher consolidation periods are risky because the price has probably been very extended in a way that indicates that the buyers will soon be losing their control. Let's study an example of a Bull Flag of RIGL on August 30, 2016.
•
Example of Bull Flag formation with two consolidation periods on RIGL.
This is an exam ple of two Bull Flag Patterns. It is norm ally hard to catch the first Bull Flag, and you will probably miss it, but your scanner should alert you to it. Let's look at an example from my scanne r in this time period :
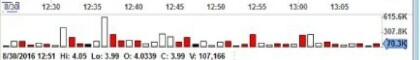
Example of my intra day Bull Flag Strategy.
As you can see, my scanner showed RIGL at 12:36:15 pm. As soon as I saw that, I realized that there was also a very high relative volume of trading, which made this a perfect setup for day trading . I waited for the first consolidation period to finish and, as soon as the stock started to move towards its high for the day, I jumped into the trade. My stop loss would be the breakdown of the consolidation period. I marked my exit and entry in the picture below. As you can see, if you had wanted to wait for a second consolidation period in hope of the third Bull Flag, you would probably have been stopped out. That is why I usually enter the first and second Bull Flags, but not the third one.
Entry, stop and exit of a Bull Flag Strategy on RIGL.
To summarize my trading strategy:
When I see a stock surging up (either on my scanner or when advised by someone in our chatroom), I patiently wait until the consolidation period. I do not jump into the trade right away (you will recall that is the dangerous act of "chasing").
I watch the stock during the consolidation period. I choose my share size and stop and exit strategy.
As soon as prices are moving over the high of the consolidation candlesticks, I enter the trade. My stop loss is the break below the consolidation periods.
I sell half of my position and take a profit on the way up. I bring my stop loss from the low of the consolidation to my entry price (break even).
I sell my remaining positions as soon as my target hits or I feel that the price is losing steam and the sellers are gaining control of the
price action.
As I mentioned, many people, including myself, buy only at or near the breakout (similar to the ABCD Pattern). The Bull Flag is essentially an ABCD Pattern that will happen more on low float stocks. It's fast and it will fade away more quickly. Therefore, it is more or less a Momentum Scalping Strategy. Scalpers buy when a stock is running. They rarely like to buy during consolidation (during that waiting and holding phase). These types of stocks usually drop quickly and brutally so it is important for you to jump only when there is a confirmation of breakout. Waiting for the stocks to break the top of a consolidation area is a way of reducing your risk and exposure time. Instead of buying and holding and waiting, which increases exposure time, scalpers just wait for the breakout and then send their order. Get in, scalp, and get out quickly. That's the philosophy of momentum scalpers:
Get in at the breakout
Take your profit
Get out of the way
The Bull Flag Pattern is found within an uptrend in a stock. The Bull Flag is a long-based strategy. You should not short a Bull Flag. I persona lly don't trade much momentum. It is a risky strategy and beginners should be very careful trading these. If you choose to, trade only small size and only after sufficient practice in simulators. You will also need a super-fast execution system for scalping.
Top and Bottom Reversals are among the easiest trading strategies. Day traders love using them because they have a very defined entry and exit point and a very high profit-to-loss ratio. In this section, I'm going to explain how to find reversal setups using scanners, how to read the Bollinger Bands to find extremes, how to use indecision or Doji candlesticks to take an entry, how to understand where to set your stops and your profit targets, and how to trail your winners.
If you are part of our private chatroom, you will hear me say time and time again that what goes up, must come down. Don' t chase the trade if it is too extended. The inverse is also true. What goes down will definitely come back up to some extent. When a stock starts to sell off significantly, there are two reasons behind it:
Institutional traders and hedge funds have started selling their large position to the public market and the stock price is tanking.
Retail traders have started short selling the stock but they will have to cover their shorts sooner or later. That is where you wait for an entry. When short sellers are trying to cover their shorts, the stock will reverse.
I'm going to illustrate this strategy with a few examples so that you can see exactly what to look for. Below is an example of what it looks like to find a stock that's sold off really hard right after the market opens. Moves like this are extremely hard to catch for the short side, because when you find the stock, it is already too late to enter the short selling trade. But please, remember the mantra : What goes up, must come down. Therefore, you have the option of waiting for a reversal opportunity.
Example of a Reversal Strategy on EBS.
Each Reversal Strategy has four important elements:
At least 5 candlesticks (5 min) moving upward or downward.
The stock is trading close to or outside of the Bollinger Bands. Bollinger Bands are an indicator of volatility, and stocks usually stay inside of these bands.
The stock will have an extreme RSI indicator (Relative Strength Index). An RSI above 90 or below IO will pique my interest. If you are not familiar with what an RSI indicator is, you can do a Google search or ask me in our chatroom. Your trading platform will probably have an RSI indicator built into it.
These three elements demonstrate that a stock is really stretched out, and you must pay close attention to the scan for all of these data points. You must simultaneously look for a certain RSI level, a certain number of consecutive candles, and a certain position within the Bollinger Bands.
When the trend is going to end, usually indecision candles, such as a spinning top or Doji, form. That is when we need to be ready.
In reversal trading, you are looking for one of these indecision candlesticks - spinning tops or Dojis. They are an indication that the trend may soon change. A Doji is a candle that has a wick longer than its body. You can see a picture of a bearish Doji below It has that long upper wick that some would call a top and tail and that others would call a shooting star. This candle tells us four things: the open price, the close price, the high of that period and the low of that period. So, when you have a candle with a top tail, you know that at some point during that candle period the price moved up, was unable to hold at that level, and was then sold off It depicts a bit of a battle taking place between the buyers and the sellers in which the buyers lost their push up. It is a good indication that the sellers may soon control the price and will push that price down.
The same is true about a bullish Doji. You can also see a picture of a bullish Doji below It has that long lower wick that some would call a bottom tail and others would call a hammer. When you have a hammer candle with a bottom tail, you know that at some point during that candle period the price moved down, was unable to hold at those low levels, and was bought up. This indicates a battle between the buyers and the sellers in which the sellers lost their push down. It is a good indication that the buyers may now gain control of the price and push that price up.
Biulls in control
9
ShootingStar Do]ii
fndedsion
!Bears in c:ont11ol
Sellers push lower
Top Reversal Strategy with an indecision Shooting Star candlestick formed as sign of entry.
In reversal trading, you look for either Doji or indecision candlesticks. They are an indication that the trend may soon change. In Reversal Strategies, you are looking for a clear confirmation that the pattern is beginning to reverse. What you definitely don't want is to be on the wrong side of a reversal trade, or, as we call it, "catching a falling knife". It doesn't sound like a good idea in real life and it's not a good idea in trading. It means that when a stock is selling off badly (the falling knife), you don't want to buy on the assumption that it should bounce. If the stocks are dropping, you want to wait for the confirmation of the reversal. This will usually be (1) the formation of a Doji or indecision candle and
(2) the first I-minute or the first 5-minute candle to reach a new high. That is my entry point. I set my stop at the lows.
In reversal trading, the RSI should be at the extremes (above 90, below I0), and that final candle should be outside the Bollinger Bands. Once you have your entry requirements listed, you must then look for an actual entry. An entry for me is going to be either the first I-minute or the first 5- minute candle to reach a new high.
When you've had a long run of consecutive candles making new lows, the first candle that makes the new high is very significant. That's my entry point. There are times when I'll use the I-minute chart, but typically I'll wait for the 5-minute chart because it is a much better confirmation. The 5-minute chart is cleaner. The first 5-minute candle to make a new high is the point at which I get in the reversal, with a stop either at the low of the day or simply down around 20 to 30 cents. Usually, if a stock goes 30 cents against me, I will admit defeat, recognize that I mistimed my entry, and try again rather than continue to hold. At times, especially on stocks that are more expensive or more volatile, I'll simply use a 20- or 30-cent arbitrary stop if the low of the day is too far away.
Once


Comments (0)